Today’s product managers, particularly those in the B2B SaaS space, have access to enormous amounts of data. And while more data is typically a good thing, it can be a challenge to separate signal from noise. In the early days of product management, product delivery was the only metric that really mattered. Now, product managers need to do more than just put out features. They need to build memorable experiences and cultivate user delight.
So which are the metrics the modern PM must master? Brian Crofts, the chief product officer of Pendo, says there are certain KPIs that every product leader should keep top-of-mind. Let’s look at three of them in more detail.
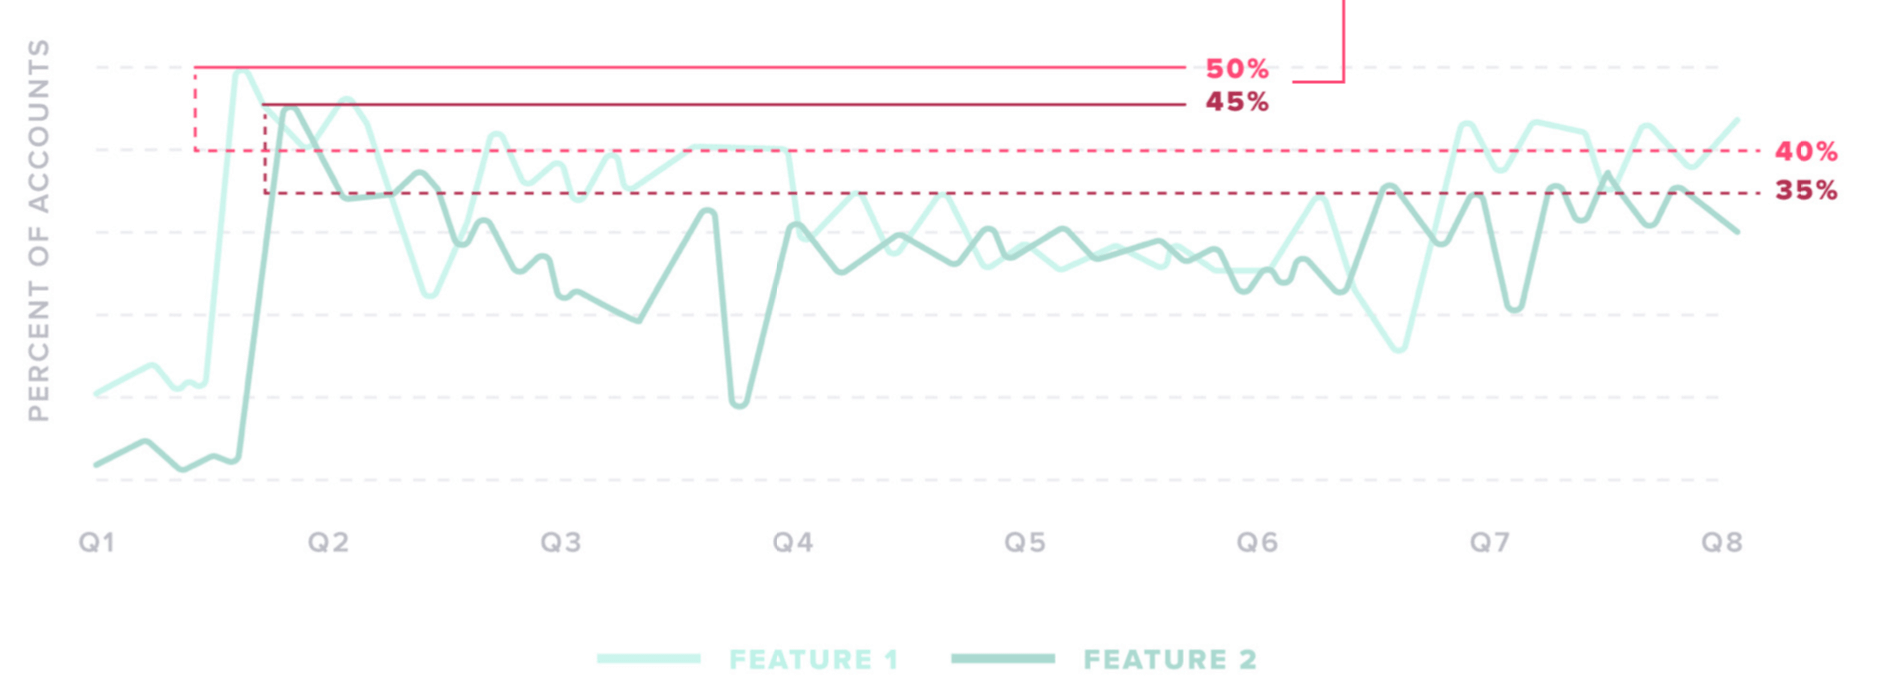
Feature Adoption
Here’s an all-too-common scenario: the product team spends months building a particular feature, the marketing team promotes its launch, and … no one ends up using it. Or far fewer users than expected interact with it. In fact, up to 80% of product features go unused, and those that do gain initial traction typically lose users over time.
To keep this situation from happening again and again, PMs should keep an eye on feature adoption rates.
How to Measure It
First, you’ll want to select a time frame over which to measure feature adoption. For example, you may want to consider adoption within one week of launch. Then calculate the percentage of total users who engage with the feature in question. A caveat: some users may be unlikely to use a feature simply due to the nature of their role within the organization. Measuring feature adoption at the account level might be more useful if you suspect that’s the case. Ideally, you’d measure feature adoption both ways.
Don’t stop with adoption rates directly after launch. Examine feature retention rates 30 days following launch as well to get a sense of typical drop-off patterns.
Why It’s Important
Let’s say you’re planning to launch your next feature. What should be your initial adoption goal? What percentage of users should be interacting with the feature a month or two down the road? Historical data on feature adoption is key for goal setting and evaluating the success of feature launches.
Product Stickiness
If a product is sticky, users don’t just interact with it once and then forget about it. Instead, they engage with it on a regular basis. It becomes an integral part of their professional life.
How to Measure It
This metric is an easy one to calculate because there’s a simple formula for it. Just take the ratio of your daily active users (DAU) to your monthly active users (MAU) to get your “stickiness score.” This represents the percentage of your monthly users who use your product every day. The higher the percentage, the stickier the product.
Why It’s Important
You want your users to rely on your product and interact with it regularly. Ideally, you want your product to become something they can’t live without. The more “sticky” features you offer, the higher the chances of providing real and sustainable value to your users.
Product Usage
Some of your features will get a lot of use, and some will go untouched (and they might not be the ones you’d expect). By measuring product usage, you can get a sense of the overall health of your product.
How to Measure It
Pendo measures product usage using the “BDF Framework.” The acronym refers to breadth, depth, and frequency. Breadth is the number of people using the product for a given account and is measured by the number of active users for a given customer within the last 30 days. Depth is related to the usage of “sticky” features. To measure depth, select 5 to 8 key features that serve as leading indicators for retention, then calculate their usage levels. Frequency is how often users access the product. It’s equal to the number of logins across all users for a given customer within the last 30 days.
Why It’s Important
The only way you’ll know what parts of your product are flourishing and which are failing is to look at product usage. You may find that the features with low adoption rates could be improved with increased promotion and awareness. Or you may find it’s time to sunset them. Armed with this data, you’ll be able to make a solid decision.
Want to know more about the metrics every PM should monitor? Pendo’s latest ebook, “10 KPIs Every Product Leader Needs to Know,” goes through seven additional metrics and offers real-world insights on data-driven product management. We encourage you to give it a read!