As product management becomes more data-driven, product teams are increasingly adopting methodologies from data science, analytics, and related fields to inform their strategies. One of these is predictive modeling.
When considering whether to deploy a predictive model, your management team might ask, “What is the level of accuracy?” And they’re right to ask that question. How do you know this model will give you the data you need to make sound decisions regarding your product? Is it even worth your time to build and deploy this model?
However, when talking about accuracy, it’s important to compare the accuracy that your model provides in comparison to what you do now without the model.
Many companies make decisions based primarily on gut feeling. This may sound foolish, but it’s not necessarily a bad practice. The key is to measure the accuracy of that gut feeling. If your predictive model performs much better than your guesstimates, you know it’s worth moving forward with that model. And over time, you can tweak the model to improve its accuracy.
Is Your Gut More Accurate Than You Think?
To compare apple to apples, use both your gut and your predictive model to answer the same question. Then compare the two answers with the actual outcome to determine the level of accuracy for each.
Let’s illustrate this with a theoretical situation. Maybe you’re trying to predict which machines will fail in the coming week to prioritize maintenance. Your gut says Machines W, X, Y, and Z will fail. Your predictive model tells you that M, W, X, and Y will fail. At the end of the week, you see that Machines M, W, and X actually failed. Your gut has an accuracy level of 50% (two out of four correct). On the other hand, your model was 75% accurate.
In that case, you should take this model live. Over time, you can work toward improving your accuracy incrementally in future updates. Maybe the first model you deploy to production has 75% accuracy. Then you engage with customers and get feedback on the entire end-to-end usage of the predictive system, all while continuing to improve its accuracy. Maybe the second version includes new data and you tweak the model to get 78% accuracy. Maybe the third version improves to 88% accuracy as you continue to get gather customer feedback.
Look Out for Imbalanced Data
Accuracy level may be a simple measure for the management team to look at, but it has its limitations. One of these arises when your data is imbalanced.
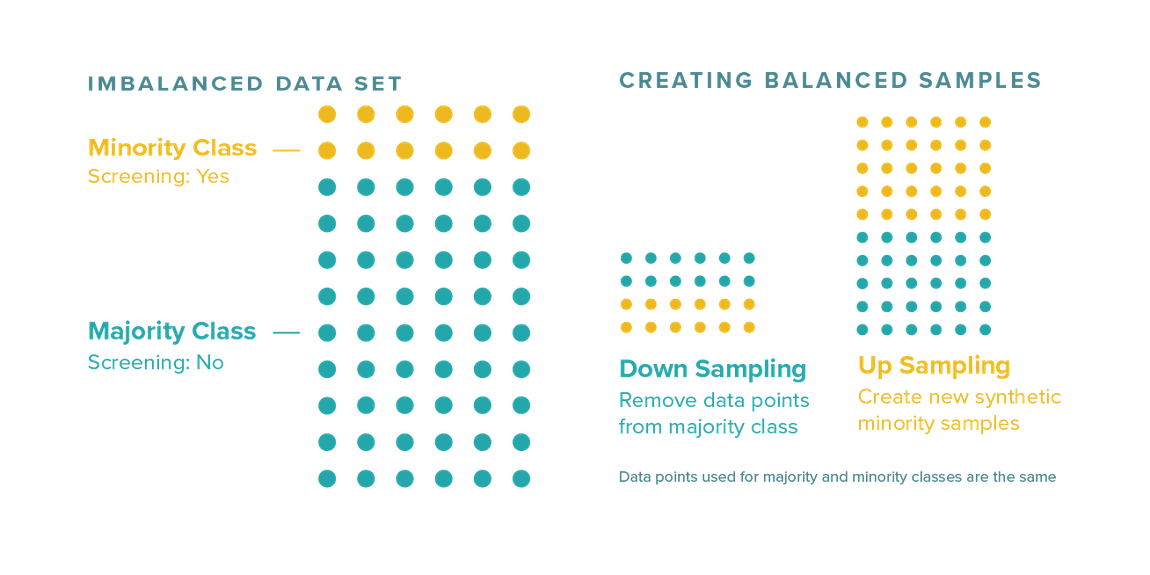
Let’s take a healthcare example to predict if a patient needs to be screened for cancer. 95% of patients do not need to be screened for cancer. Five percent do need to be screened for cancer. This is an imbalanced data set, as one class has a huge majority (>85%) over the other.
If an algorithm makes a lazy prediction and says no one needs to be screened for cancer, the model will still be right 95% of the time. However, the consequences will be disastrous for the 5% it misses. With imbalanced data like this, we need to look at potential fixes. For example, you might sample the data to balance it. Sampling involves making the number of data points for both the majority and minority classes the same by either removing some from the majority class or creating new synthetic samples of the minority class.
Or, you might consider using additional evaluation metrics.
Evaluate Your Predictions Using Additional Metrics
Let’s continue with our medical example. Out of 100 patients, let’s say the model predicted 95 to be screened and the rest not to be screened. Of those 95 predicted to be screened, it got 91 right and four wrong. Out the five predicted not to be screened, it got two correct and missed three.
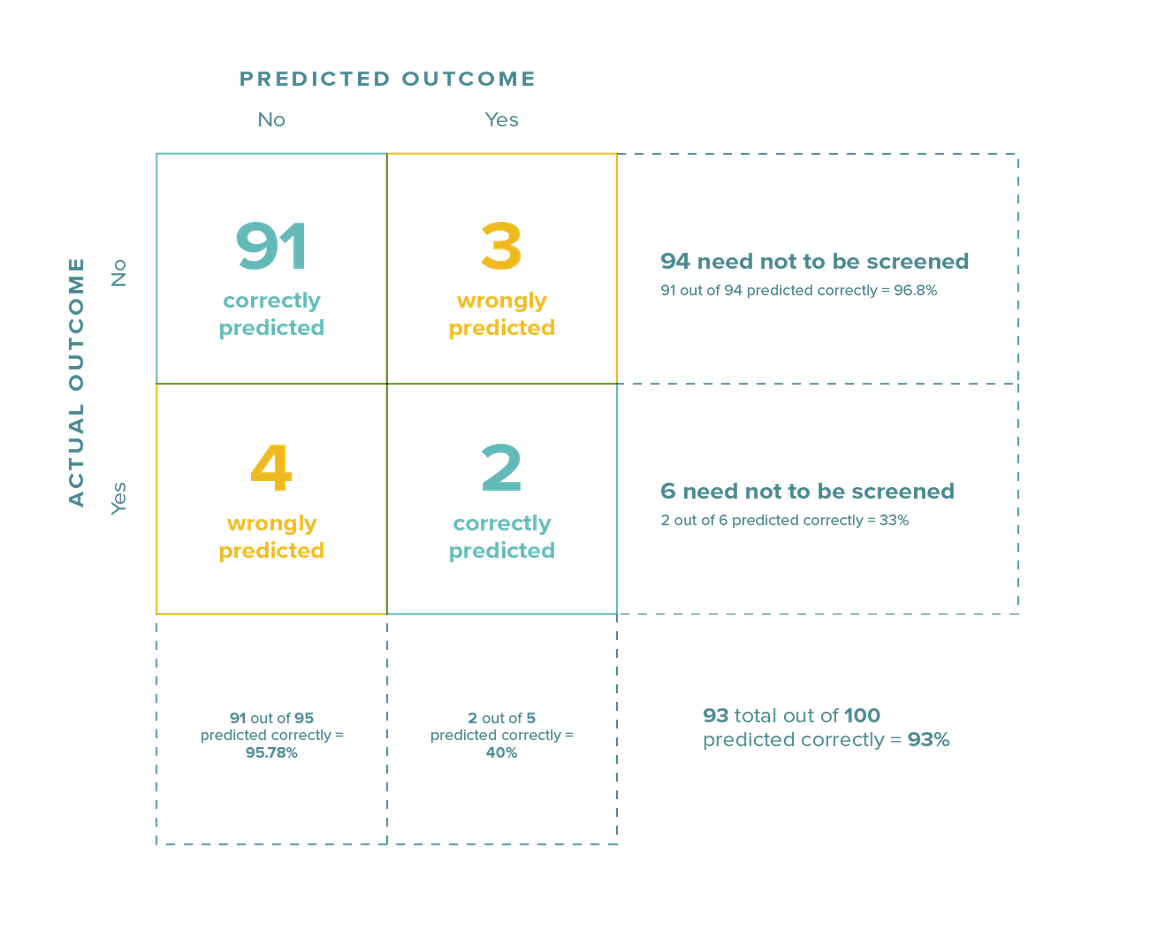
Looking at the diagram above, we can draw the following conclusions:
- The model predicted 93 out of 100 patients correctly. So, the overall accuracy is 93%.
- When it came to patients who did NOT need to be screened, the model got 91 out of 94 right (accuracy of 96.8 %)
- For patients who DID need to be screened, the model got 2 out of 6 right (accuracy of 33%).
- When the model says a patient need not be screened, it’s right 91 out of 95 times (accuracy of 95.8%).
- When the model says a patient needs to be screened, it’s right 2 out of 5 times (accuracy of 40%).
So, the model is doing a decent job of predicting who does not need to be screened but doing a terrible job of predicting who does need to be screened.
What does that mean in practical terms? It means I would trust the model more when it says someone need not be screened, but be far more skeptical when it says someone does need to be screened. For more detail on the above method, refer to this article.
Your own predictive model may be accurate in some situations and inaccurate in others. The only way to know for sure is to look at the data.
Don’t Wait for the Stars to Align
Reasonable accuracy does not mean perfect accuracy — and a reasonably accurate predictive model may be worlds better than what you currently have in place. Don’t wait for perfection. Once you deploy your predictive analytics, the feedback from end users will give you a baseline so you can continue to adjust and improve the model.
Figure out how to solve common challenges of predictive analytics, including how to identify the right problem to focus on and how to distribute the information to the right people. Incorporate workflows inside the application so your users can act based on these insights. Listen to the data and continue to improve the model, your distribution strategy, and the actions your users can take.
Once you’ve started demonstrating the return on investment (ROI) of your predictive analytics, you can add more data and incorporate new insights into other parts of your business workflows. Every small success will give your organization significant boosts in competitive differentiation and revenue drivers.